Synthesis in living cells with the assistance of supramolecular nanocarriers
Sherif Shaban Ragab, Ek Raj Thapaliya, Yang Zhang, Sicheng Tang, Jeffrey Blye McMahan, Sheyum Syed, Burjor Captain, Françisco M. Raymo
RSC Advances - Mar 21, 2016
https://doi.org/10.1039/C6RA04335F
Abstract
Independent supramolecular nanocarriers can transport pairs of complementary reactants inside living cells in two consecutive incubation steps. After the second internalization step, the nonemissive reactants produce a fluorescent product with the concomitant appearance of intense fluorescence exclusively in the intracellular space. These results demonstrate that supramolecular delivery can be exploited to perform chemical reactions inside target cells and can lead to valuable strategies for the intracellular synthesis of drugs.
Introduction
The incorporation of hydrophobic and hydrophilic segments along a common polymer backbone produces amphiphilic macromolecules capable of assembling spontaneously into supramolecular constructs in aqueous environments.1–7 Noncovalent contacts bring the hydrophobic domains of distinct macromolecular components together to prevent their direct exposure to the many surrounding water molecules. Solvation of the hydrophilic counterparts maintains the resulting nanoscaled assemblies in solution and prevents their further association into microscaled aggregates. The ultimate result is the formation of supramolecular nanostructures with hydrophobic interior and hydrophilic surface.
The subtle balance of enthalpic and entropic terms guiding the assembly of multiple amphiphilic macromolecules into a single supramolecular construct can also promote the encapsulation of molecular guests in the interior of the resulting nanosized hosts.8–26 Hydrophobic compounds interact preferentially with the hydrophobic domains of the amphiphilic building blocks, rather than being exposed to water. As a result, molecules that would otherwise be insoluble in aqueous environments can be loaded in the interior of these supramolecular containers and transported across hydrophilic phases. In fact, self-assembling nanoparticles of amphiphilic polymers can be valuable delivery vehicles to carry hydrophobic drugs from the extracellular space to intracellular targets.
The noncovalent interactions holding distinct amphiphilic building blocks together in aqueous solution are reversible. The associated macromolecular components can separate and then assemble again with relatively fast kinetics at ambient temperature. As a result, distinct supramolecular nanocarriers can exchange their constituent amphiphiles as well as their cargo. These dynamic processes can be monitored spectroscopically with the aid of chromophoric labels and energy-transfer schemes.27–38 For example, nanoparticles loaded exclusively with energy donors and nanocarriers encapsulating only energy acceptors can be combined in the same solution. If the two sets of supramolecular containers exchange their cargo, complementary chromophoric guests eventually co-localize within the same nanosized host. Under these conditions, the excitation energy of the donors is transferred efficiently to the proximal acceptors with concomitant emission of the latter, instead of the former, chromophores. Therefore, the detection of significant acceptor fluorescence, instead of donor emission, is indicative of the exchange of the molecular guests among distinct supramolecular hosts.
Our laboratory recently demonstrated that self-assembling nanoparticles of amphiphilic macromolecules can exchange energy donors and acceptors inside living cells.38 Specifically, two distinct sets of nanocarriers can transport donors and acceptors separately from the extracellular to the intracellular space in two consecutive steps. The internalized supramolecular hosts can then exchange their molecular guests to allow the transfer of energy exclusively in the intracellular environment. In principle, the very same delivery strategy could be exploited to transport complementary reactants, instead of chromophores, inside living cells and only then allow their chemical reaction. Such a protocol would be especially valuable to activate a given drug exclusively inside a target cell. For example, two distinct sets of nanocarriers could transport intracellularly protected drugs and activators respectively to allow their chemical reaction, only after cellular internalization, and convert the former species from an inactive form to their active state. In this context, a chemical transformation capable of converting a pair of nonemissive reactants into a fluorescent product efficiently, even under the mild experimental conditions associated with the intracellular environment, would be a particularly convenient model system to establish if this general supramolecular strategy can also enable reactions in living cells. This article reports the implementation of these operating principles on the basis of a fluorogenic transformation designed around the established ability of phosphines to add on azides (Staudinger reaction) in aqueous solution under mild conditions.39
Results and Discussion
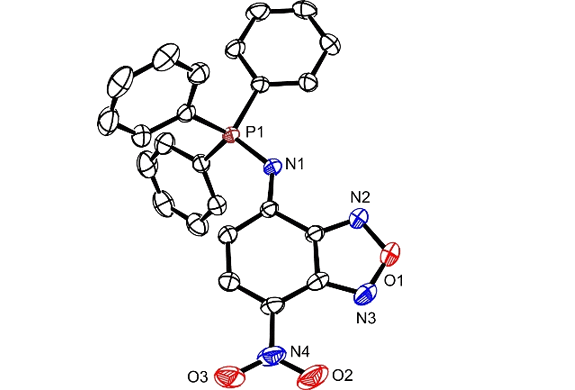
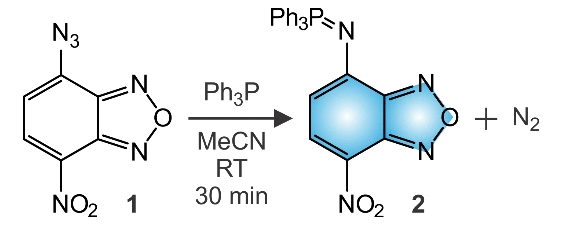
Stirring an equimolar MeCN solution of 1 and Ph3P for 30 min at ambient temperature produces 2 in a yield of 80% (Fig. 1). The phosphine addition on the azide group and the concomitant release of molecular nitrogen is consistent with literature precedents40 on related compounds and is confirmed by the m/z of 441 detected for [M + H]+ in the electrospray ionization mass spectrum (ESIMS) of the product. Additionally, resonances for the protons and carbon atoms of the three phenyl rings and benzofurazan heterocycle as well as for the phosphorous atom are evident in the corresponding 1H, 13C and 31P nuclear magnetic resonance (NMR) spectra (Fig. S1–S3). Furthermore, the X-ray diffraction analysis of single crystals, obtained after vapor diffusion of Et2O into a CHCl3 solution of 2, confirms unequivocally the structure of this particular compound (Fig. 2 and Table S1).‡
The absorption spectrum (a in Fig. 3) of 1 in MeCN shows a band at 388 nm and remains unchanged for hours (a and b in Fig. S4), if the solution is maintained at ambient temperature in the dark. Instead, the addition of one equivalent of Ph3P causes a gradual decrease in absorbance at this wavelength and the concomitant growth of another band at 480 nm over the course of 200 min (b in Fig. 3). The developing absorption resembles the band observed in the spectrum of a MeCN solution of 2 (c in Fig. 3), confirming, once again, that 1 reacts with Ph3P to form this particular compound.
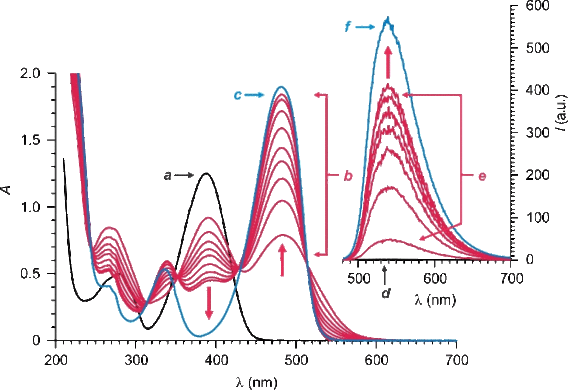
Illumination of a MeCN solution of 1 at 470 nm does not cause any detectable fluorescence (d in Fig. 3). Upon addition of one equivalent of Ph3P, however, an emission band develops at 529 nm over the course of 200 min (e in Fig. 3), in agreement with the formation of 2. In fact, the emission spectrum (f in Fig. 3) of a MeCN solution of 2 shows essentially the same band with a quantum yield of 0.84.
The characteristic absorption of the three phenyl rings of Ph3P can be detected in phosphate buffer saline (PBS) only in the presence of significant amounts of 3 (a–c in Fig. S5).¶,41 Indeed, this particular amphiphilic polymer assembles into nanoparticles capable of capturing hydrophobic guests in their interior and transfer these, otherwise insoluble, species into aqueous solutions.38,41,42 Similarly, 1 is sparingly soluble in aqueous environments and a weak absorption can only be detected at 394 nm in a saturated PBS solution of this compound (a in Fig. S6). However, a 2.5-fold increase in absorbance (b in Fig. S6) is observed in the presence of 3 (1.0 mg mL–1), indicating that the amphiphilic polymer facilitates the transfer of this benzofurazan chromophore into the aqueous solution.
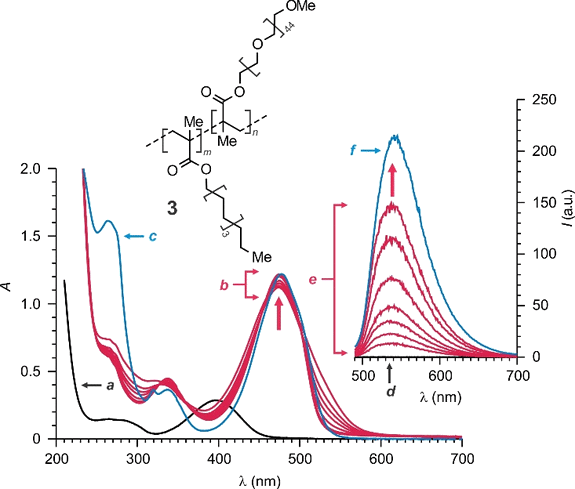
The absorption spectrum (a and b in Fig. S7) of a PBS solution of 1 and 3 does not change for hours, if the sample is maintained at ambient temperature in the dark. However, a new band develops at 475 nm over the course of 110 min (a and b in Fig. 4), if the solution is instead mixed with another PBS solution containing Ph3P and 3. The developing absorption resembles the one detected in the spectrum (c in Fig. 4) of a PBS solution of 2 and 3, suggesting that 1 can react with Ph3P to produce 2 also under these experimental conditions.§ Furthermore, this chemical transformation causes, once again, the appearance of intense fluorescence. Specifically, illumination at 480 nm results in significant emission only after mixing the PBS solution of 1 and 3 with the PBS solution of Ph3P and 3 (d and e in Fig. 4). The growing emission band is essentially identical to the one detected for a PBS solution of 2 and 3 (f in Fig. 4), suggesting that the same chromophore is responsible for both.
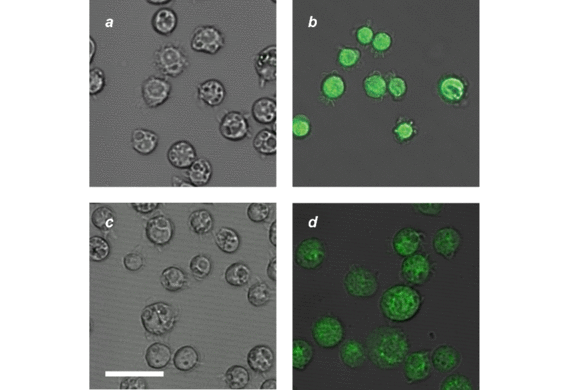
Incubation of Drosophila melanogaster S2 cells with a PBS solution of 1 and 3 does not result in any intracellular fluorescence (a in Fig. 5). The subsequent incubation of the very same cells with a PBS solution of Ph3P and 3, however, causes the appearance of intense emission in the intracellular space (b in Fig. 5). A similar result is also observed if the order of the two incubation steps is inverted. Specifically, treatment of the cells with Ph3P and 3 first does not produce any intracellular fluorescence (c in Fig. 5). The subsequent addition of 1 and 3 produces, once again, intense emission inside the cells (d in Fig. 5). These observations suggest that the two nonemissive reactants travel from the extracellular into the intracellular space where they react to form a fluorescent product.
Interestingly, the emission intensity detected inside the cells is instead negligible (a and b in Fig. S9), if the incubation steps with 1 are performed in the absence of 3. The benzofurazan component is sufficiently soluble in the aqueous extracellular medium to be administered into the biological preparation without the amphiphilic polymer. Under these conditions, however, the amount of internalized reactant is relatively modest and weak intracellular emission can only be observed, after its reaction with the uptaken Ph3P. Thus, the amphiphilic polymer is essential to facilitate the intracellular transport of the two complementary reactants and permit the formation of the fluorescent product inside the cells.
Conclusions
These results demonstrate that self-assembling nanoparticles of amphiphilic polymers can transport a nonemissive benzofurazan chromophore and Ph3P inside living Drosophila melanogaster S2 cells in independent incubation steps. After the internalization of both, the phosphine adds on the azide substituent of the benzofurazan to produce a fluorescent product. The appearance of intense fluorescence exclusively in the intracellular space indicates that these operating principles enable the chemical reaction of complementary reactants inside living cells. Thus, this supramolecular strategy could evolve into a general protocol for the intracellular delivery of activators and prodrugs to allow the synthesis of a given drug directly inside a target cell.
Acknowledgments
The National Science Foundation (CHE-1049860) is acknowledged for financial support.
Notes
‡ Crystal data for 2: C24H17N4O3P, Mr = 440.39, monoclinic, space group P21/n, a = 11.9130(5) Å, b = 8.4877(3) Å, c = 21.1543(9) Å, β = 104.391(1) °, V = 2071.88(14) Å3, Z = 4, T = 296 K, Mo Kα = 0.71073 Å. GOF = 1.035, No. Parameters = 289, 2ϴmax = 60 °. The final R1(F2) was 0.0391 for 4975 reflections I>2 σ(I). CCDC No. 1450616.
¶ Polymer 3 was prepared following a literature procedure (ref. [41](#ref41)). Its number average molecular weight is 21 kDa. The ratio between the numbers (m and n in Fig. 3) of hydrophobic and hydrophilic repeating units is 3.5:1. The values of these two parameters translate into a critical concentration of 21 μg mL–1 in PBS. At concentrations greater than this particular value, an average of 26 copies of 3 assembles into particles with average hydrodynamic diameter of 26 nm.
§ In principle, 2 could react with surrounding H2O molecules to produce the corresponding primary amine (4 in Fig. S8) and Ph3PO. The absorption and emission spectra (a and c in Fig. S8) of a PBS solution of 2 and 3, however, differ significantly from those (b and d in Fig. S8) of a PBS solution of 3 and 4. These observations suggest that 2 does not undergo hydrolysis under these experimental conditions.
Supplementary Information
Experimental Procedures
Materials and methods.
Chemicals were purchased from commercial sources and used as received with the exception of MeCN, which was distilled over CaH2, and H2O, which was purified with a Barnstead International NANOpure DIamond Analytical system. Compounds 1 and 3 were prepared according to literature procedures.S1,S2 EISMS was performed with a Bruker micrOTO-Q II spectrometer. NMR spectra were recorded with a Bruker Avance 400 spectrometer. Fourier transform infrared spectra (FTIR) spectra were recorded on neat samples with a Perkin Elmer Frontier spectrometer.
7-Nitro-N-(triphenylphosphoranylidene)benzo[c][1,2,5]oxadiazol-4-amine (2).
Ph3P (65 mg 0.4 mmol) was added to a solution of 1 (52 mg, 0.4 mmol) in MeCN (20 mL) and the mixture was stirred for 30 min at ambient temperature. The resulting precipitate was filtered off, washed with hexane (20 mL) and dried to afford 2 (88 mg, 80%) as a red solid. ESIMS: m/z = 441.1117 [M + H]+ (m/z calcd. for C24H18N4O3P = 441.1133); 1H NMR [(CD3)2SO]: δ = 5.97 (1H, d, 8 Hz), 7.64–7.69 (6H, m), 7.79–7.74 (3H, m), 7.85–7.90 (6H, m), 8.25 (1H, d, 8 Hz) ppm; 13C NMR (CDCl3): δ = 110.1, 110.3, 123.1, 126.2, 127.2, 128.3, 129.3, 129.5, 132.6, 132.7, 133.3, 133.4, 135.7, 144.7, 144.8, 150.3, 150.5, 153.9 ppm; 31P NMR [(CD3)2SO]: δ = 15.03 ppm; FTIR: v = 1610, 1512, 1479, 1437, 1294, 1249, 1098, 995, 916, 802 cm–1.
Crystallographic analysis.
Red single crystals suitable for X-ray diffraction analysis were obtained after vapor diffusion of Et2O into a CHCl3 solution 2. The data crystal was glued onto the end of a thin glass fiber. X-Ray intensity data were measured with a Bruker SMART APEX2 CCD-based diffractometer, using Mo Kα radiation (λ = 0.71073 Å).S3 The raw data frames were integrated with the SAINT+ program by using a narrow-frame integration algorithm. Corrections for Lorentz and polarization effects were also applied with SAINT+. An empirical absorption correction based on the multiple measurement of equivalent reflections was applied using the program SADABS. The structure was solved by a combination of direct methods and difference Fourier syntheses and refined by full-matrix least-squares on F2 with the SHELXTL software package.S4 Crystal data, data collection parameters and results of the analyses are listed in Table S1. The compound crystallized in the monoclinic crystal system and the space group P21/n was chosen based on the systematic absences in the intensity data. All non-hydrogen atoms were refined with anisotropic displacement parameters. Hydrogen atoms were placed in geometrically idealized positions and included as standard riding atoms during the least-squares refinements.
Absorption and emission spectroscopies.
CH2Cl2 solutions of 3 (2.5 mg mL–1, 400 μL) and either 1 (83 μg mL–1, 100 μL) or Ph3P (104 μg mL–1, 100 μL) were mixed and the solvent was distilled off under reduced pressure. The residue was dispersed in PBS (1.0 mL) and the resulting dispersions were sonicated for 5 min, stored for 10 min at ambient temperature, passed through a syringe filter (200 nm) and used for the spectroscopic measurements without further purification. Absorption spectra were recorded with a Varian Cary 100 Bio spectrometer in quartz cells with a path length of 1.0 cm. Emission spectra were recorded with a Varian Cary Eclipse spectrometer in aerated solutions. The fluorescence quantum yield of 2 was determined against a fluorescein standard, following a literature protocol.S5
Fluorescence imaging.
Drosophila melanogaster S2 cells were cultured in Shields and Sang M3 Insect Medium (39.4 g L–1) with fetal bovine serum (15%, v/v), penicillin-streptomycin solution (1% v/v at a final concentration of 100 k units L–1 penicillin and 100 mg L–1 streptomycin) and KHCO3 (0.5 g L–1) and incubated at 22 °C. The cells were seeded in glass-bottom plates at a density of 5 × 10⁴ cells mL–1 and incubated for 30 min at 22 °C.
CH2Cl2 solutions of 3 (16 mg mL–1, 1.0 mL) and either 1 (2 mg mL–1, 60 μL) or Ph3P (2 mg mL–1, 80 μL) were mixed and the solvent was distilled off under reduced pressure. The residue was dispersed in PBS (1.0 mL) and the resulting dispersions were sonicated for 5 min and incubated with the cultured cells without further purification.
The cultured cells were incubated with a PBS solution (5%, v/v) of 1 (120 μg mL–1) and 3 (16 mg mL–1) for 30 min washed twice with PBS (100 μL), imaged, incubated further with Ph3P (160 μg mL–1) and 3 (16 mg mL–1) for another 30 min, washed twice with PBS (100 μL) and imaged again. The same protocol was repeated inverting the order of the two incubation steps. Alternatively, the cultured cells were incubated with a PBS solution (5%, v/v) of 1 (120 μg mL−1) for 30 min, washed twice with PBS (100 μL), incubated further with a PBS dispersion (5%, v/v) of Ph3P (160 μg mL–1) and 3 (16 mg mL–1) for another 30 min and imaged. Once again, the same protocol was repeated inverting the order of the two incubation steps. All images were recorded with a Leica SP5 confocal laser-scanning microscope.
References
1 (a) A. Halperin, M. Tirrell and T. P. Lodge, Adv. Polym. Sci. 1992, 100, 31; (b) T. P. Lodge, Macromol. Chem. Phys. 2003, 204, 265; (c) A. O. Moughton, M. A. Hillmyer and T. P. Lodge Macromolecules 2012, 45, 2
2 (a) M. Moffitt, K. Khougaz and A. Eisenberg, Acc. Chem. Res. 1996, 29, 95; (b) N. S. Cameron, K. M. Corbierre and A. Eisenberg, Can. J. Chem. 1999, 77, 1311.
3 S. E. Webber, J. Phys. Chem. B 1998, 102, 2618.
4 G. Riess, Prog. Polym. Sci. 2003, 28, 1107.
5 I. M. Okhapkin, E. E. Makhaeva and A. R. Khokhlov, Adv. Polym. Sci. 2006, 195, 177.
6 T. S. Kale, A. Klaikherd, B. Popere and S. Thayumanavan, Langmuir 2009, 25, 9660.
7 S. C. Owen, D. P. Y. Chan and M. S. Shoichet, Nano Today 2012, 7, 53.
8 H. Bader, H. Ringsdorf and B. Schmidt, Angew. Makromol. Chem. 1984, 123, 457.
9 K. Kataoka, G. S. Kwon, M. Yokoyama, T. Okano and Y. Sakurai, J. Control Release 1993, 24, 119.
10 M.-C. Jones and J.-C. Leroux, Eur. J. Pharm. Biopharm. 1999, 48, 101.
11 V. P. Torchilin, J. Control Release 2001, 73, 137.
12 M. L. Adams, A. Lavasanifar and G. S. Kwon, J. Pharm. Sci. 2003, 92, 1343.
13 A. G. Husseini and W. G. Pitt, Adv. Drug Deliv. Rev. 2008, 60, 1137.
14 K. Mondon, R. Gurny and M. Moller, Chimia 2008, 62, 832.
15 J. H. Park, S. Lee, J. H. Kim, K. Park, K. Kim and I. C. Kwon, Prog. Polym. Sci. 2008, 33, 113.
16 S. Kim, Y. Shi, J. Y. Kim, K. Park and J.-X. Cheng, Expert Opin. Drug. Deliv. 2010, 7, 49.
17 (a) R. T. Chacko, J. Ventura, J. Zhuang and S. Thayumanavan, Adv. Drug. Deliv. Rev. 2012, 64, 836; (b) J. Zhuang, M. R. Gordon, J. Ventura, L. Li and S. Thayumanavan, Chem. Soc. Rev. 2013, 42, 7421.
18 Y. Wang and S. M. Grayson, Adv. Drug Deliv. Rev. 2012, 64, 852.
19 A. Lalatsa, A. G. Schatzlein, M. Mazza, B. H. L. Thi and I. F. Uchegbu, J. Control. Rel. 2012, 161, 523.
20 (a) J. Nicolas, S. Mura, D. Brambilla, N. Mackiewicz and P. Couvreur, Chem. Soc. Rev. 2013, 42, 1147; (b) S. Mura, J. Nicolas and P. Couvreur, Nat. Mater. 2013, 12, 991.
21 Y. Lu and K. Park, Int. J. Pharm. 2013, 452, 198.
22 J. Y. Tyler, X.-M. Xu and J.-X. Cheng, Nanoscale 2013, 5, 8821.
23 D. R. Wang and X. G. Wang, Prog. Polym. Sci. 2013, 38, 271.
24 L. Gu, A. Faig, D. Abdelhamid and K. Uhrich, Acc. Chem. Res. 2014, 47, 2867.
25 D. Y. Alakhova and A. V. Kabanov, Mol. Pharm. 2014, 11, 2566.
26 A. Makino, Polym. J. 2014, 46, 783.
27 Y. Hu, M. C. Kramer, C. J. Boudreaux and C. L. McCormick, Macromolecules 1995, 28, 7100.
28 (a) H. Chen, S. Kim, W. He, H. Wang, P. S. Low, K. Park and J. X. Cheng, Langmuir 2008, 24, 5213; (b) H. T. Chen, S. W. Kim, L. Li, S. Y. Wang, K. Park and J. X. Cheng, Proc. Natl. Acad. Sci. USA 2008, 105, 6596; (c) S.-Y. Lee, J. Y. Tyler, S. Kim, K. Park and J. X. Cheng, Mol. Pharmaceutics 2013, 10, 3497.
29 G. N. Njikang, M. Gauthier and J. M. Li, Polymer 2008, 49, 5474.
30 (a) S. Jiwpanich, J. H. Ryu, S. Bickerton and S. Thayumanavan, J. Am. Chem. Soc. 2010, 132, 10683; (b) J. H. Ryu, R. T. Chacko, S. Jiwpanich, S. Bickerton, R. P. Babu and S. Thayumanavan, J. Am. Chem. Soc. 2010, 132, 17227; (c) S. Bickerton, S. Jiwpanich and S. Thayumanavan, Mol. Pharmaceutics 2012, 9, 3569.
31 K. J. Chen, Y. L. Chiu, Y. M. Chen, Y. C. Ho and H. W. Sung, Biomaterials 2011, 32, 2586.
32 J. Lu, S. C. Owen and M. S. Shoichet, Macromolecules 2011, 44, 6002.
33 P. Hua and N. Tirelli, React. Funct. Polym. 2011, 71, 303.
34 T. O. McDonald, P. Martin, J. P. Patterson, D. Smith, M. Giardiello, M. Marcello, V. See, R. K. O'Reilly, A. Owen and S. Rannard, Adv. Funct. Mater. 2012, 22, 2469.
35 (a) Y. P. Li, M. S. Budamagunta, J. T. Luo, W. W. Xiao, J. C. Voss and K. S. Lam, ACS Nano 2012, 6, 9485; (b) Y. P. Li, W. W. Xiao, K. Xiao, L. Berti, J. T. Luo, H. P. Tseng, G. Fung and K. S. Lam, Angew. Chem. Int. Ed. 2012, 51, 2864.
36 N. M. Javali, A. Raj, P. Saraf, X. Li and B. Jasti, Pharm. Res. 2012, 29, 3347.
37 A. S. Klymchenko, E. Roger, N. Anton, H. Anton, I. Shulov, J. Vermot, Y. Mely and T. F. Vandamme, RSC Advances 2012, 2, 11876.
38 (a) S. Swaminathan, C. Fowley, B. McCaughan, J. Cusido, J. F. Callan and F. M. Raymo, J. Am. Chem. Soc. 2014, 136, 7907; (b) S. Swaminathan, C. Fowley, E. R. Thapaliya, B. McCaughan, S. Tang, A. Fraix, B. Captain, S. Sortino, J. F. Callan and F. M. Raymo, Nanoscale 2015, 7, 14071; (c) E. R. Thapaliya, C. Fowley, B. Callan, S. Tang, Y. Zhang, J. F. Callan and F. M. Raymo, Langmuir 2015, 31, 9557.
39 M. Kohn and R. Breinbauer, Angew. Chem. Int. Ed. 2004, 43, 3106.
40 G. C. Fortman, B. Captain and C. D. Hoff, Inorg. Chem., 2009, 48, 1808.
41 I. Yildiz, S. Impellizzeri, E. Deniz, B. McCaughan, J. F. Callan and F. M. Raymo, J. Am. Chem. Soc. 2011, 133, 871.
42 (a) J. Cusido, M. Battal, E. Deniz, I. Yildiz, S. Sortino and F. M. Raymo, Chem. Eur. J. 2012, 18, 10399; (b) S. Swaminathan, M. Petriella, E. Deniz, J. Cusido, J. D. Baker, M. L. Bossi, F. M. Raymo, J. Phys. Chem. A 2012, 116, 9928; (c) E. Deniz, M. Tomasulo, J. Cusido, I. Yildiz, M. Petriella, M. L. Bossi, S. Sortino and F. M. Raymo, J. Phys. Chem. C 2012, 116, 6058; (d) M. Petriella, E. Deniz, S. Swaminathan, M. J. Roberti, F. M. Raymo and M. L. Bossi, Photochem. Photobiol. 2013, 89, 1391.
S1 S. J. Lord, H. D. Lee, R. Samuel, R. Weber, N. Liu, N. R. Conley, M. A. Thompson, R. J. Twieg, W. E. Moerner, J. Phys. Chem. B, 2010, 114, 14157.
S2 I. Yildiz, S. Impellizzeri, E. Deniz, B. McCaughan, J. F. Callan, F. M. Raymo, J. Am. Chem. Soc., 2011, 133, 871.
S3 Apex2 Version 2.2-0 and SAINT+ Version 7.46A; Bruker Analytical X-Ray System, Inc., Madison, Wisconsin, USA, 2007.
S4 (a) G. M. Sheldrick, SHELXTL Version 6.1; Bruker Analytical X-Ray Systems, Inc., Madison, Wisconsin, USA, 2000. (b) G. M. Sheldrick, Acta Cryst., 2008, A64, 112.
S5 J. R. Lakowicz, Principles of Fluorescence Spectroscopy; Springer: New York, 2006.